Interactive desktop application for visualizing camera trap data

😇 Looking for Funding
We rely on support from our community. It's because of your contributions that we can carry out these projects and partnerships, helping us fulfill our mission. Please consider sponsoring this project.
The Growing Role of Recording Devices in Conservation
In recent years, conservation efforts have increasingly relied on various recording devices such as camera traps and acoustic sensors. Their growing popularity is driven by technological advancements, reduced costs, and the ability to collect extensive data non-invasively. These tools have revolutionized wildlife monitoring, providing researchers with invaluable data on animal behavior, population dynamics, and ecosystem changes. However, as the volume of recorded data grows, so does the challenge of managing, analyzing, and effectively utilizing it.
Advancements in Machine Learning for Camera Trap Data
Machine learning (ML) has played a pivotal role in addressing data processing challenges, leading to the development of numerous tools designed to automate species identification and behavior analysis. Surveys such as the Camera Trap Data Management Survey on Wildlabs and catalogs like the Camera Trap ML Survey showcase the growing ecosystem of ML-based solutions. However, while AI-driven classification has made data processing more efficient, the focus has largely remained on the automation aspect rather than on how conservationists can explore and interpret the processed results.
Bridging the Gap: Making Data Accessible to Conservationists
Despite advancements in AI, conservationists often struggle to make use of processed data due to a lack of technical skills or funding for specialized analytics. Simply classifying species in images is not enough—researchers need user-friendly tools to interactively explore trends, spatial patterns, and ecological insights derived from their datasets.
To address this challenge, we are developing a cross-platform desktop application that will enable conservationists to locally import classified observations and visualize the data through interactive tools. Unlike web-based platforms like Wildlife Insights, a desktop app ensures data privacy, supports large datasets without the need for extensive uploads, and remains accessible in remote field locations. Our goal is to create an application that is easy to install and use—requiring no technical expertise beyond a simple double-click installation.
Features
Our application will provide a suite of visualization tools designed to enhance data exploration:
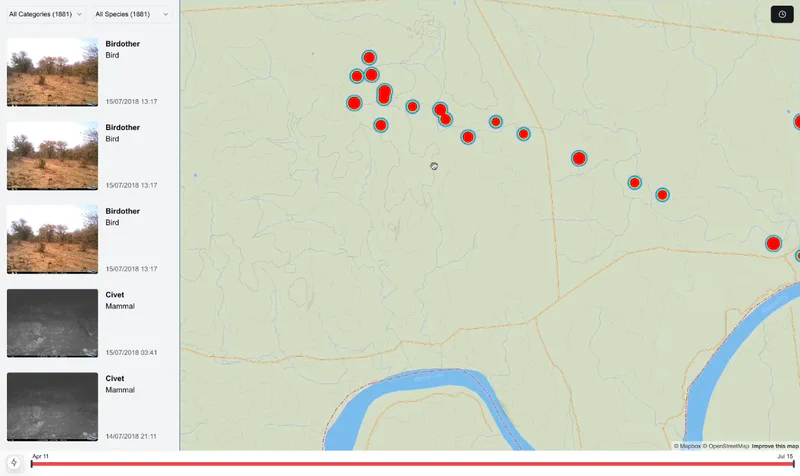
- Spatio-temporal analysis: An interactive map displaying camera trap locations, heatmaps, and species distribution over time.
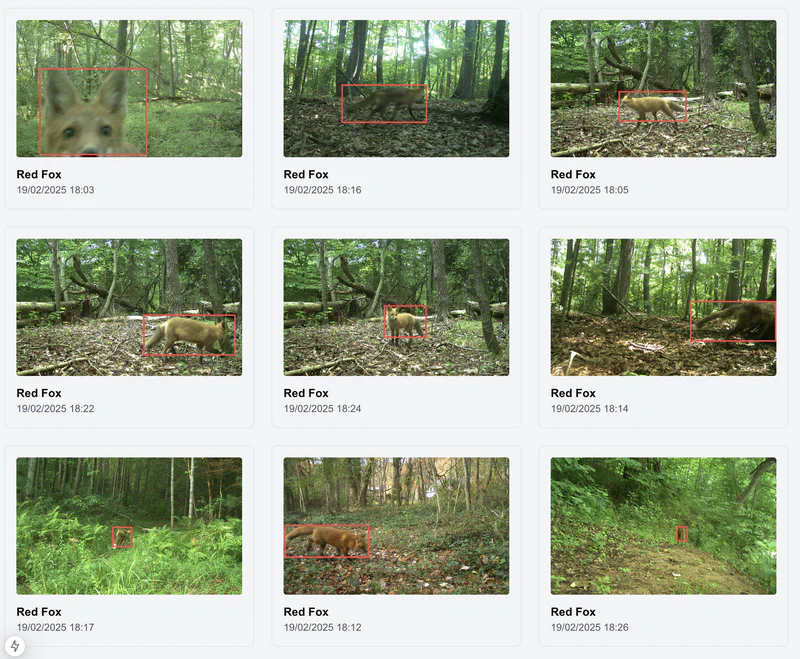
- Species filtering: Users can filter observations by species to analyze trends and behavioral patterns.
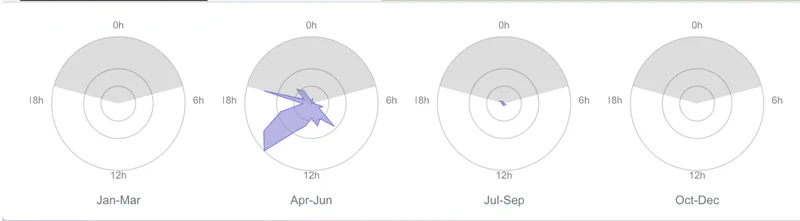
- Daily and seasonal activity patterns: Charts displaying animal activity fluctuations at different times of the day and across seasons.
- Advanced analytics: Population estimation models, multi-species interaction analysis, and individual animal tracking.
Technical Approach
We are building our application using Electron and React, leveraging their popularity and strong ecosystems to encourage contributions and maximise longevity. Mapbox will be used for interactive mapping, and the project will be open-source on GitHub to encourage community collaboration and contributions.
Conclusion
With this interactive data exploration tool, we aim to bridge the gap between AI-powered classification and practical conservation insights. By empowering researchers and conservationists with intuitive visualizations, we hope to make wildlife monitoring more effective and accessible, ultimately contributing to better conservation outcomes.
Snow Leopard Monitoring
